
The Dangers of a Flattening Yield Curve
What is the Yield Curve?
The yield curve displays the relationship between the interest rates of bonds, known as ‘yields’, and their maturity dates at a point in time. The shape of the curve often reflects expectations of where economic growth and inflation are headed. A ‘normal’ yield curve is upward sloping, showing that longer-maturity bonds have a higher yield compared to shorter-maturity bonds. This makes sense because a short term bond typically carries less interest rate risk, and is priced for a lower yield accordingly.
What Has the Curve Looked Like and Where is it Going?
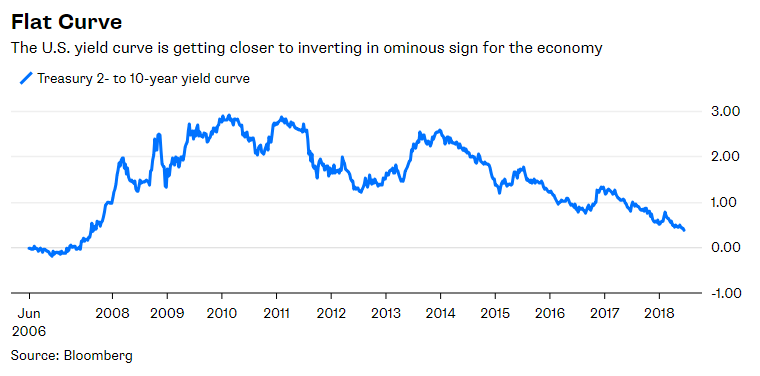
For nearly 8 years after the 2008 recession, short term interest rates have remained close to 0%, maintaining a normal yield curve, which reflects a growing economy. After 2015 however, the Fed started to steadily increased rates, and the yield curve slowly flattened, causing the gap between short- and long-term U.S. bond yields to fall to the lowest level since 2007. So far, 2018 has already seen two hikes in the federal funds rate and predicts more increases in the future. This means that desirable new bonds with higher yields will be introduced to the market and older bonds with lower rates will decrease in value, causing the curve to flatten. The short-term bonds, or the ‘short-end’, tends to be primarily influenced by monetary policy decisions. The long-term bonds however, or the ‘long-end’, are influenced by the outlook on inflation, economic growth, supply-and-demand, and attitude towards risk. By raising interest rates, the fed is increasing the short-end of the curve. The graph below shows the size of the gap between 2- and 10-year Treasury bond yields, reflecting a flattening curve as the short-end rises and the gap narrows.
What is the Danger?
The concern is that we are heading in the direction of an ‘inverted’ yield curve. An inverted yield curve occurs when short-term bonds are actually yielding more than long-term bonds. This typically occurs when investors are expecting slower economic growth in the future. Historically, an inverted yield curve has preceded all 9 recessions since 1955. Thus, further flattening of the yield curve may signal the end of the current economic cycle. After recent rate hikes, the spread between yields on 2- and 10-year Treasury bonds has fallen below 30 basis points, reflecting a similar spread to that of August, 2007, a few months before the 2008 recession.
Economic growth in the United States has been solid in recent quarters and near-term growth projections continue to improve. Additionally, inflation readings have picked up and in June recorded the highest 12 month reading since early 2012. With those considerations along with their unemployment goal also having been met, the Fed may continue to push the federal funds rate higher. Meanwhile, heavy demand for longer-term bonds has kept medium to long-term rates low, even as short-term rates have gone up. These factors have combined to produce a flattened yield curve, and if recent trends continue with further increases in the federal funds rate without a move higher in longer-term rates, a yield curve inversion could be what ensues.
How does all this Affect You?
With a flattening yield curve, investors will find that they don’t receive additional compensation in the form of yield for owning longer duration bonds. Also, if the yield curve is flattening due to rising short-term rates, those short duration bonds can experience periods of price declines. Other impacts could be on areas like the housing market where higher interest rates on adjustable rate mortgages can push up interest expense.
With all of the last 9 recessions having been preceded by an inverted yield curve, one of the most substantial affects would be if moves in the yield curve continue to a point of inversion, and if the inverted yield curve accurately foreshadows the end of the current economic cycle. Under a recessionary economic environment, many riskier investments such as equities and lower quality bonds tend to underperform.
What Should You Do?
An inverted yield curve is not something that you can control; it is dictated by the combination of U.S. monetary policy and the market’s supply and demand for fixed income. Federal Reserve Chairman Jerome Powell understands the need to be cautious with changes in monetary policy, as demonstrated in their objective to increase the frequency and clarity of communication with the public.
While you cannot control a yield curve, you can prepare for one. It is important to ensure your investment portfolio is positioned in line with your financial plan and investment recommendations, which take into account a long-term perspective across full economic and market cycles. The best thing that you can do is to consult a financial professional like a Registered Investment Advisor to make sure there is a plan in place, and that your 401(k), IRA, or savings are managed to that plan.
Authored by Benjamin Opsal, CFA on July 12, 2018
About the Author: Benjamin Opsal, CFA is a Portfolio Management / Investment Analyst Senior Associate at Heck Capital Advisors. Benjamin earned the right to use the Chartered Financial Analyst® (CFA®) designation after completing the program in 2016, fulfilling the work experience requirements, and gaining acceptance as a member of the CFA Institute. The Chartered Financial Analyst® (CFA®) charter gives a strong understanding of advanced investment analysis and real-world portfolio management skills. CFA® and Chartered Financial Analyst® are registered trademarks owned by CFA Institute.